Loudspeaker Coverage
Most audio system designers would agree, I think, that obtaining even sound coverage is a good design goal to aim for – or at least be a good place to start.
But what do we mean by ‘even coverage’– how even is even? Assuming that the sound level is even, will the intelligibility coverage necessarily be even?
Furthermore, which is more important, even sound pressure level (SPL) or even intelligibility as characterised by the sound transmission index (STI) or STIPA? Moreover, what do we mean when we say the SPL is even? Do we mean the SPL of the direct sound or that of the total sound? (Bear in mind here that essentially there are two main components to the sound that we hear from a loudspeaker or sound source in an enclosed space – the ‘direct sound’ ie the sound that travels directly from the source to the listener and the ‘re ected or reverberant’ part.
Now before someone who has sat in on one of my lectures or classes says no you said there are four components – there are, but I am trying to keep things simple here so let’s just stick with direct and re ected components.
However, I would suggest that intelligibility is more important – after all, if a system isn’t intelligible what is the point of having it?
Now getting back to the plot, if we specify the direct sound to be even, how do we measure this, as in the majority of indoor systems, it will be buried below the re ected and reverberant sound. Therefore an ordinary sound level meter or real time analyser is not going to be able to measure it, as such instruments can only measure the total sound level ie the direct and re ected components combined.
From an intelligibility perspective it is the ratio of the direct to re ected sound that is important.
Okay, I will come clean, in reality it is the ratio of the direct and early re ected sound to the later arriving re ections and reverberation (see, I told you so, four components!). Now back to evenness.
On the one hand, an even sound level should mean that listeners will hear the sound system at approximately the same level – which would seem like a good idea. However, I would suggest that intelligibility is more important – after all, if a system isn’t intelligible what is the point of having it? Unless you are working in an anechoic chamber or out of doors, then there is always going to be some re ected and potentially reverberant sound kicking about just waiting to get excited.
I have often been told that the aim of a good design is to get the listeners within the coverage angle of a loudspeaker. Well while that is a reasonable starting point, there is rather more to it than that. And as for those who say that you must be within the ‘direct field of the loudspeaker’ in order for a sound system to be intelligible – Well that’s pure baloney. Even with high intelligibility systems where the STI measures 0.65 or 0.70, the re ected sound field will be greater than the direct sound, so you do not need to be within the ‘direct field’ of the loudspeaker (If this were the case then 99% of all the indoor and most stadium PA systems in the UK would be unintelligible !). But let’s get back to the theme of this article – coverage. Now the pertinent question to ask is “what is the coverage angle of a loudspeaker?”
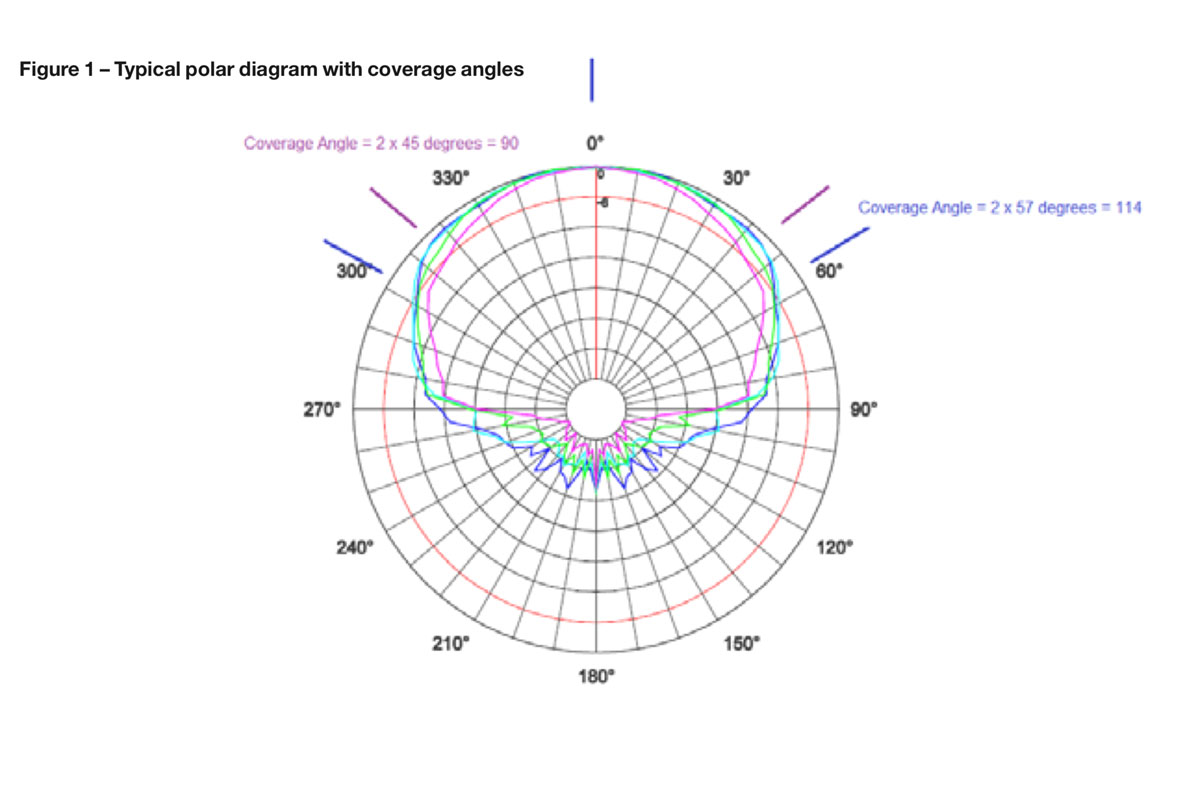
Most people, when they think about coverage angle, take it to be the angle between the minus 6 dB points. In other words, it is the included angle between the angular locations where the SPL has dropped by 6 dB relative to the on axis position.
Figure 1 shows a reasonably typical example for a well-controlled loudspeaker. The polar diagram is calibrated in 6 dB divisions which enables the 6 dB down angles to be readily found. I have indicated them with blue and magenta lines, as coverage angles are generally frequency dependent. In this case for three of the frequencies selected the value is about the same
(2 x 57° = 114 degrees) but at the fourth, shownby the magenta line, the coverage is a little narrower at 90 degrees (2 x 45°).
A simple ceiling cone loudspeaker typically has a coverage angle of around 90 to 120 degrees.
However, the coverage angle will be frequency dependent, generally being greater at low frequencies and narrowing at high frequencies.
If it is a 2 way device, i.e. it has a tweeter or high frequency horn, then the high frequency narrowing will be corrected and may become wider and more consistent or indeed may initially become wider and then start to collapse again. The point is, as a system designer, you need to know what the loudspeaker is doing / is potentially able to cover and not just at one frequency.
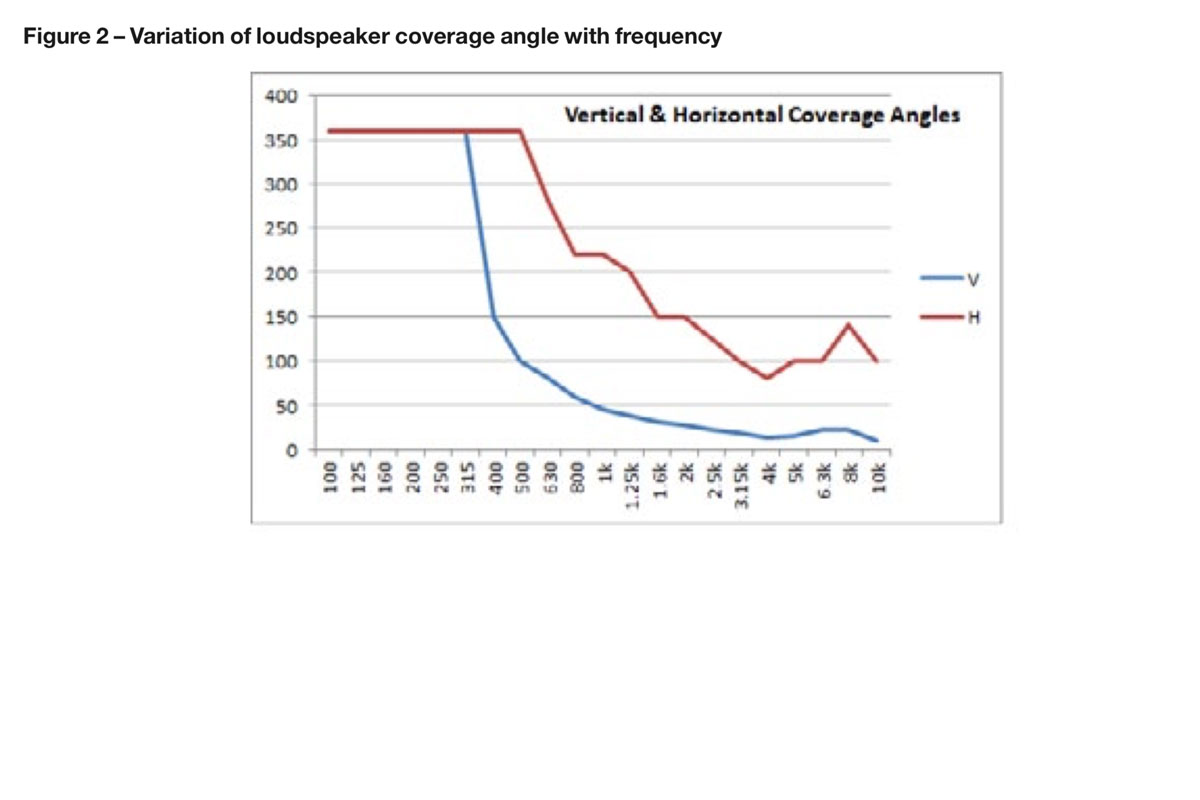
The coverage angle of some loudspeakers varies significantly with frequency as illustrated in figure 2. Be careful of the scales here, as at this resolution the vertical coverage seems reasonably uniform above 1 kHz but in fact it varies from 50° down to 10° between 1 & 4 kHz.
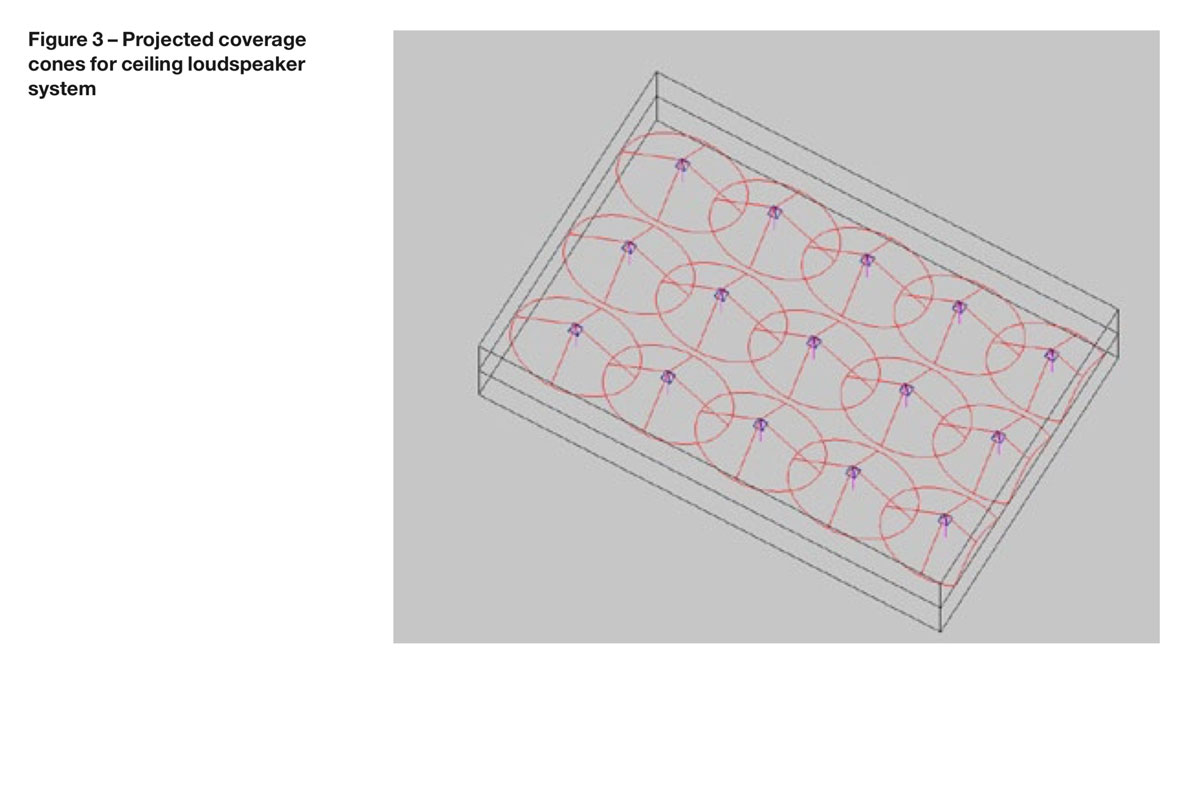
A more practical way to see how a loudspeaker is covering an area is to project the coverage angle on to the listening plane – i.e. the ear height of the listeners.
Figure 3 illustrates this for a typical ceiling loudspeaker arrangement where the loudspeakers are located with a nominal ‘edge to edge’ overlap pattern.
As can be seen, this is an efficient way of covering a space and should lead to reasonably even coverage. The objective here is to minimise the patches of grey that do not lie within the loudspeaker coverage cones. However, whilst this approach might be appropriate for a conference system or a meeting room etc, it would be overkill for a paging system in a typical office area.
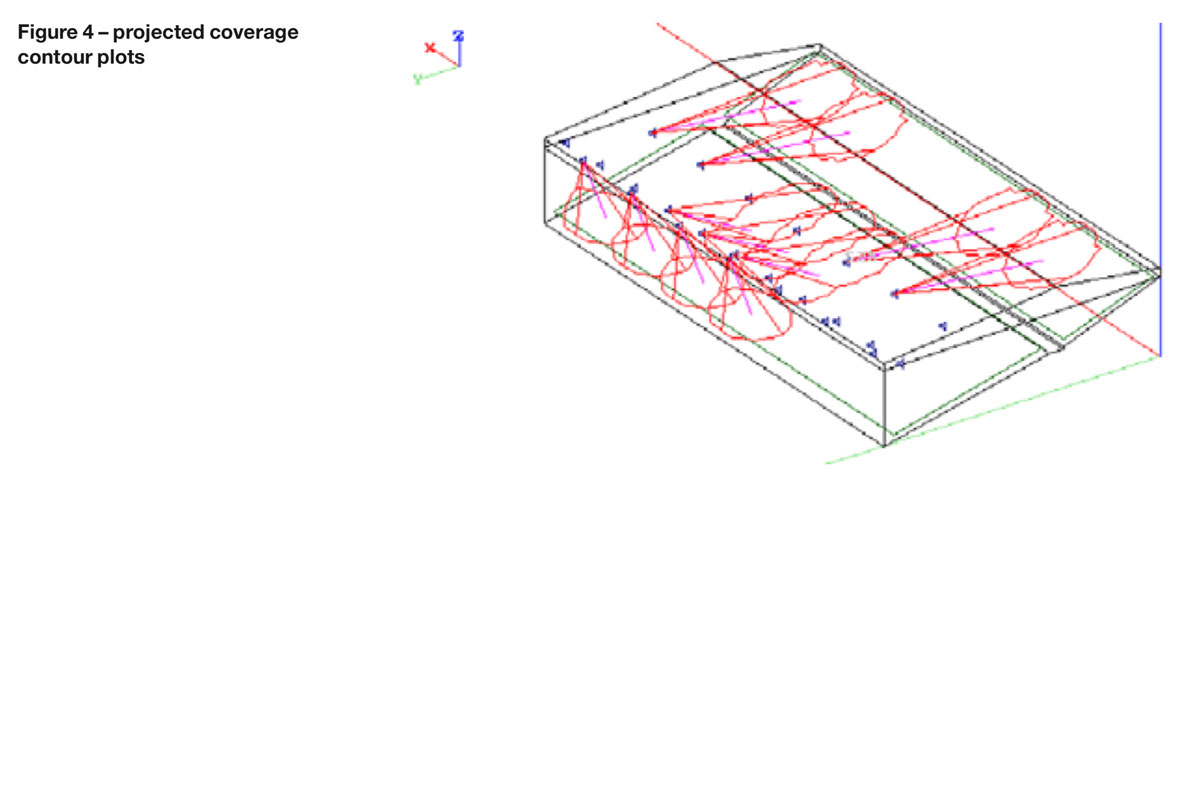
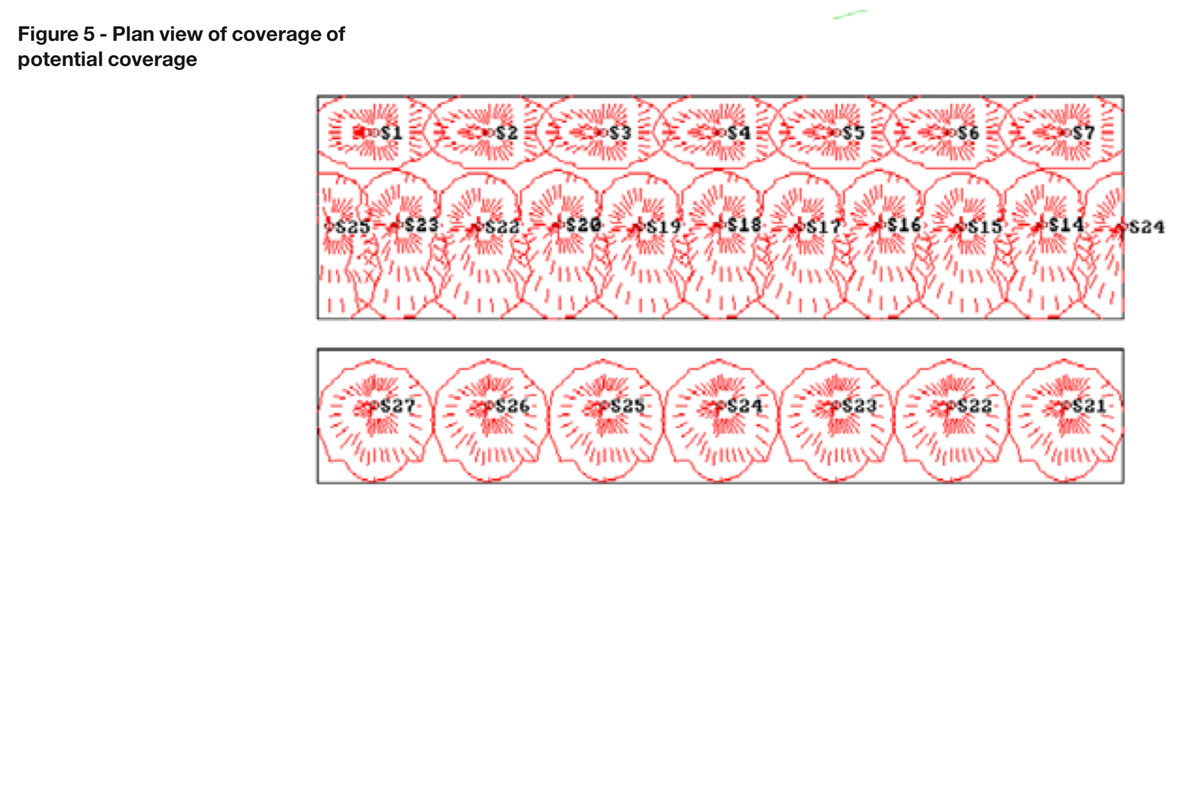
The same basic idea with regards to coverage can be applied to other situations, such as the seating area of a soccer stadium shown in figure 4. Here, for clarity, I am only showing the design with some of the loudspeakers activated. They have been spaced and located so that the projected coverage contours just touch. Figure 5 shows a plan view of the potential coverage.
However, contrary to popular belief, the projected 6 dB contours do not mean that everyone inside the contour will receive a sound level within 6 dB.
Consider for example the first or second row of loudspeakers shown in figure 4.
Due to the angle of projection, the sound covering the rear of the coverage zone has to travel further to reach its target than that at the front – although they are both being depicted as being within the 6 dB contour lines. This extra distance introduces a further loss, which in this particular case is almost an additional 3 dB. But is that a problem, as surely 3 dB is almost imperceptible?
In terms of sound level (SPL) alone, 3 dB is not a major change but in terms of potential intelligibility, 3 dB, when considered as a difference in signal to noise ratio or direct to reverberant (re ected) ratio, can be very significant and can quite literally be the difference between speech being reasonably intelligible and it being unintelligible. Furthermore, in this case the 3 dB is in addition to the loss of 6 dB, which by definition is what we were working with when designing with the 6 dB coverage angle. Now, the observant amongst you will ask immediately ask the question, if 3 dB can produce such a significant change then why on earth are we using 6 dB contours and where did they come from?
Good question!
Well for starters, no one says that you have to design using the 6 dB coverage angle (I regularly use the 3 dB contour in many of my designs) but as to where the 6 dB down definition / arrangement came from this is somewhat open to speculation.
I have asked many people in the industry around the world for their take on this and essentially the replies fall into two groups. (1) 6 dB down was chosen, as for coherent sources, such as loudspeakers, the output from adjacent loudspeakers, when 6 dB down will combine and add back to give a difference of 0 dB.
(Two identical, noise sources remember [non coherent] will add to give 3 dB addition). (2) 6 dB is a reasonable variation for a system to have. Digging around however, I found a comment from the great American audio guru, Don Davis, which paraphrasing says ‘from a single overhead point source, if you aim at the last row, and can get the source high enough so that the -6 dB angle hits half-way to the front, you get (about) the same SPL at the front and back seats’.
So, it turns an acoustical calculation into basic geometry, which in the days before computer modelling was a useful aid to speaker aiming. Whilst this effect would be true for that particular the case in mind, I have to wonder what this has this to do with ceiling speaker coverage and the practice of edge to edge pattern spacing or other closer packing ! Furthermore, as we have seen, the 6 dB coverage angle is frequency dependent – so what frequency does this rule apply to?
Where either there is a benign acoustic environment or when outdoors, the 6 dB rule can work quite well but in a difficult reverberant space, a 6 dB variation can be too great and lead to a very noticeable drop in speech intelligibility.
In benign environments, there is generally some latitude relating to what we hear but in a difficult acoustic space, (produced by background noise or high reverberation or worst still, both) there will not be so much scope. In these cases, hearing a good direct to reverberant ratio or signal to noise ratio,
extending over the frequency range important for speech intelligibility, will be crucial. So what frequency should you use to pick the coverage angle?
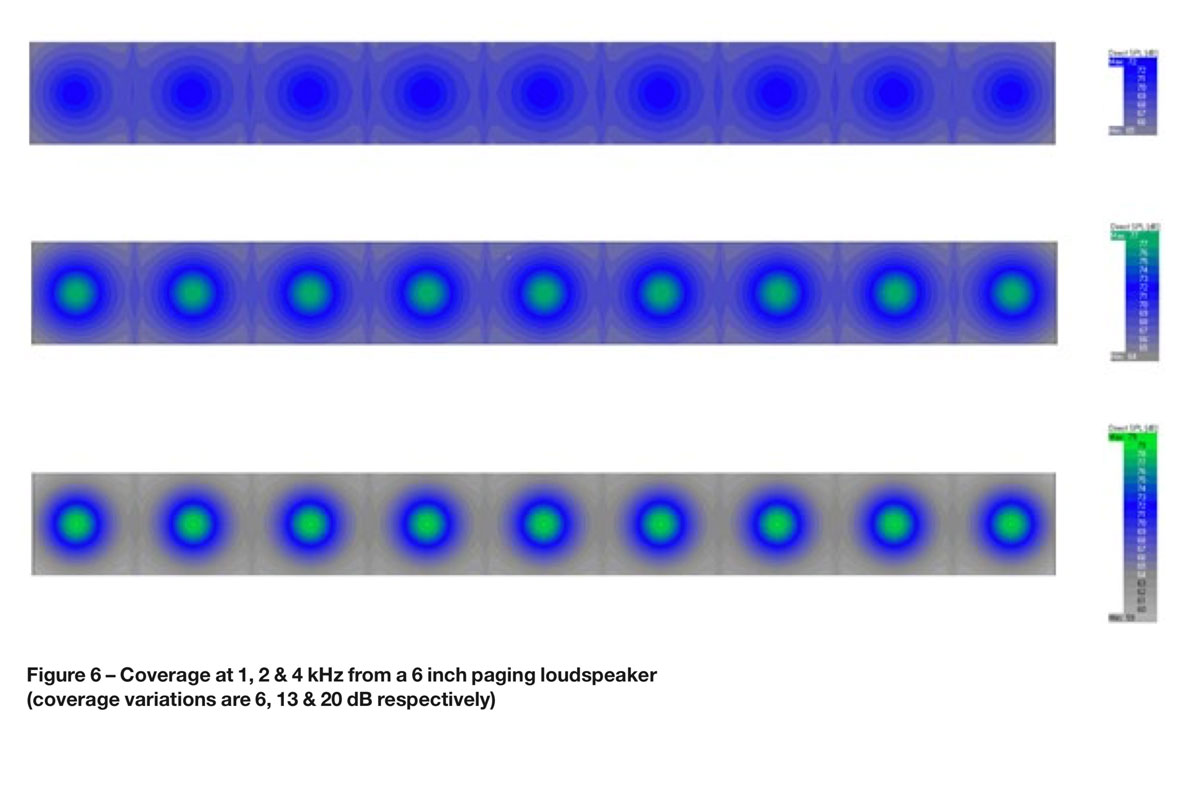
Some people use the 1 kHz band for loudspeaker coverage, but it is the 2 and 4 kHz bands that are more important for speech intelligibility, so as a minimum I would use the 2 kHz data whilst keeping a wary eye on the 4 kHz band. For example figure
6 shows the coverage from a single row of ceiling loudspeakers. They are located at a height of 4m and spaced 8m apart. The upper plot shows the coverage within the 1 kHz octave band.
There is a 6 dB variation throughout the space i.e. from on axis to off axis positions – so pretty reasonable you might think. At 2 kHz, (centre plot) however, the variation is 13 dB and distinct hotspots and patches of poorer coverage are apparent. At 4 kHz (lower plot) the variation is 20 dB – a huge and unacceptable variation. So clearly, using 1 kHz could be misleading. It is interesting to note that BS7827, the CoP for emergency sound systems at sports venues, specifically discusses the coverage requirement at 4 kHz.
To put all this into a practical context I was recently asked to comment on a loudspeaker distributor’s proposed layout for a distributed series of semi- directional loudspeakers in long and relatively narrow space. The loudspeakers were located overhead at approximately 4m above oor level or about 2.4 m above the listener’s ears – there being nowhere to mount them lower down at the sides. The reverberation time of the space was around 3.5 seconds.
Now experience tells me that any form of passive and not particularly directional distributed loudspeaker system is not going to work in such a space. Yet, without modelling or undertaking a basic acoustic calculation, the distributor put forward his idea and already had the installer on board, so I had quite a job on to protect my client (the owner) to show that the system wouldn’t work. Detailed computer modelling showed that, indeed the design would not have adequate intelligibility for a number of reasons.
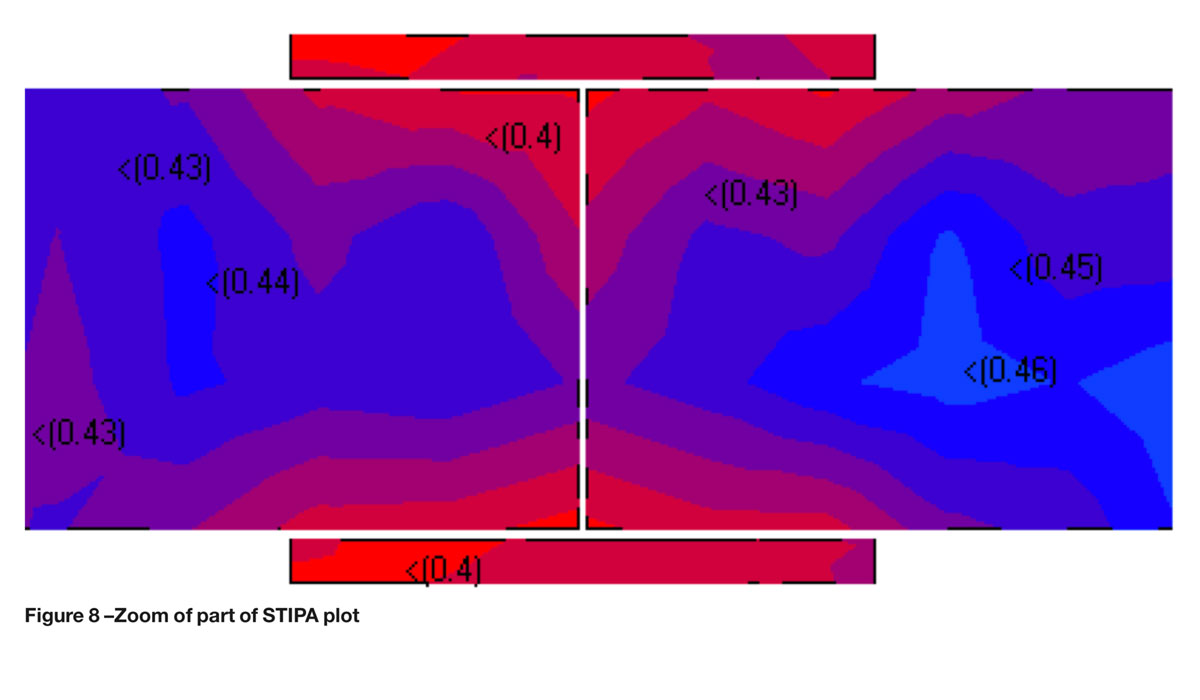
It is difficult to see the values on the figure 7, so I have zoomed in on a section in figure 8.
Now the failing values can be seen, with the average for the area in question being just 0.43 STI and with a significant percentage of the area only achieving 0.40. Looking at the speaker coverage was truly enlightening. The claimed coverage angle for the loudspeaker in question was 170° x 60° at 1 kHz and 140° x 55° at 2 kHz.
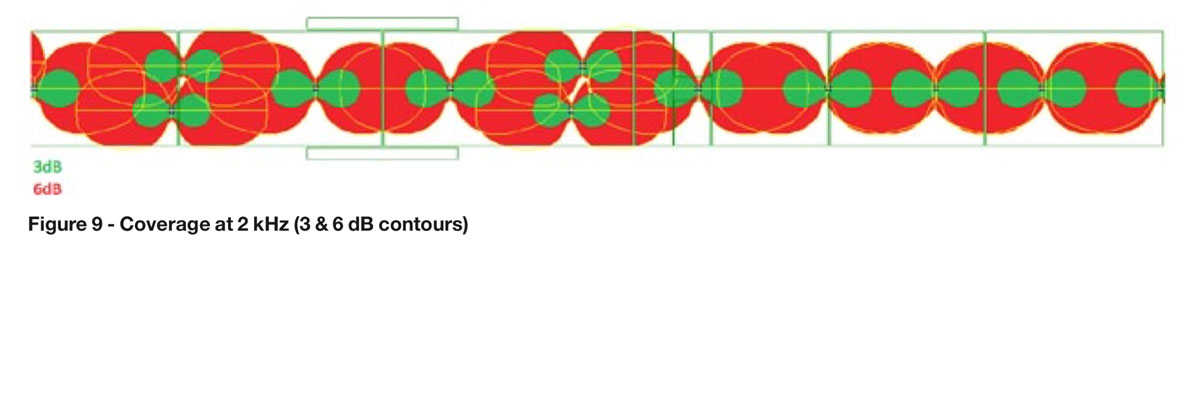
Figure 9 shows the projected3 & 6 dB contours but filled out as solid shapes to more clearly show the coverage.
As can be seen, at 2 kHz the speaker covers the central section of the space quite well but does not cover the perimeter. However, the 3 dB contour only covers a tiny fraction of the area.
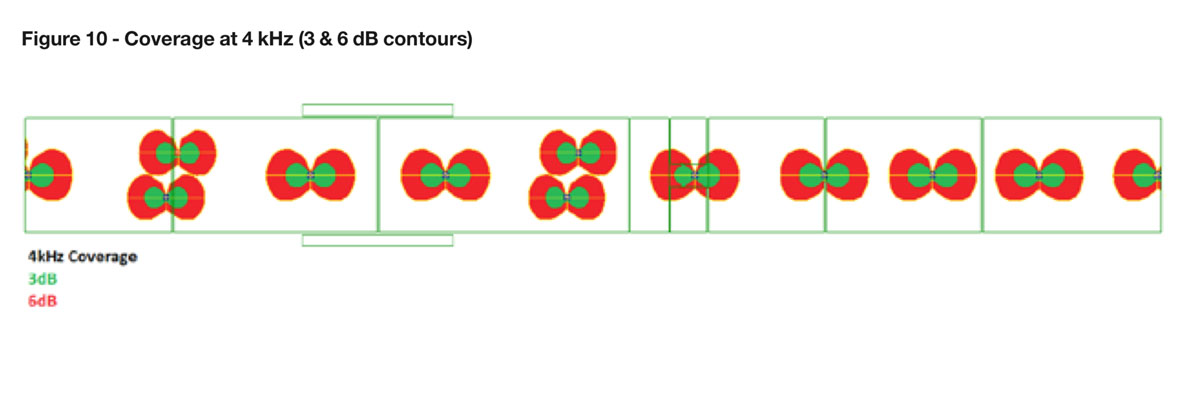
Now take a look at figure 10 and see what happens at 4 kHz – where only small parts of the central strip are covered, whilst the majority of the required area is not.
You might think that the STI plot would look a bit like the plots shown in figures 9 & 10 with small patches of intelligibility occurring at regular intervals (i.e. directly under the loudspeakers). Whilst this often happens, as I said earlier, ‘there is more to designing a sound system than just providing sound coverage’. However, in this case the loudspeaker design did
not even achieve this basic aim as the plots above clearly illustrate. The underlying point is that the space is just too reverberant to support intelligible speech from a normal distributed loudspeaker system. The loudspeaker distributor should have known this and certainly should have checked the viability of his design before presenting it and thereby causing the budget for the system to be set way too low. It is said that ‘a little learning is a dangerous thing’, which is certainly the case in audio & acoustics.
However, the really worrying aspect for me is that this is a VA system and forms the major element for informing the public of an emergency situation and helping to evacuate the complex in a safe and controlled manner. What chance the above proposal of achieving that?

